Spotlight on Chapter 7 Good Jobs for All?
This excerpt from Chapter 7 summarizes the impacts of globalization and technology on labor markets:
It is hard to see clear evidence of the ‘end of work’ in the official statistics as yet. Figure 1 plots the employment-population rate for those aged 15-74 in 2014 against that in 1991 using World Bank Data. These figures may not accurately capture all forms of employment, and are also influenced by changing demographic patterns, educational enrolments for younger workers and retirement for older workers. While there is very large variation in employment-population ratios across countries, there is no clear trend over time. This is the case for countries at all stages of economic development.
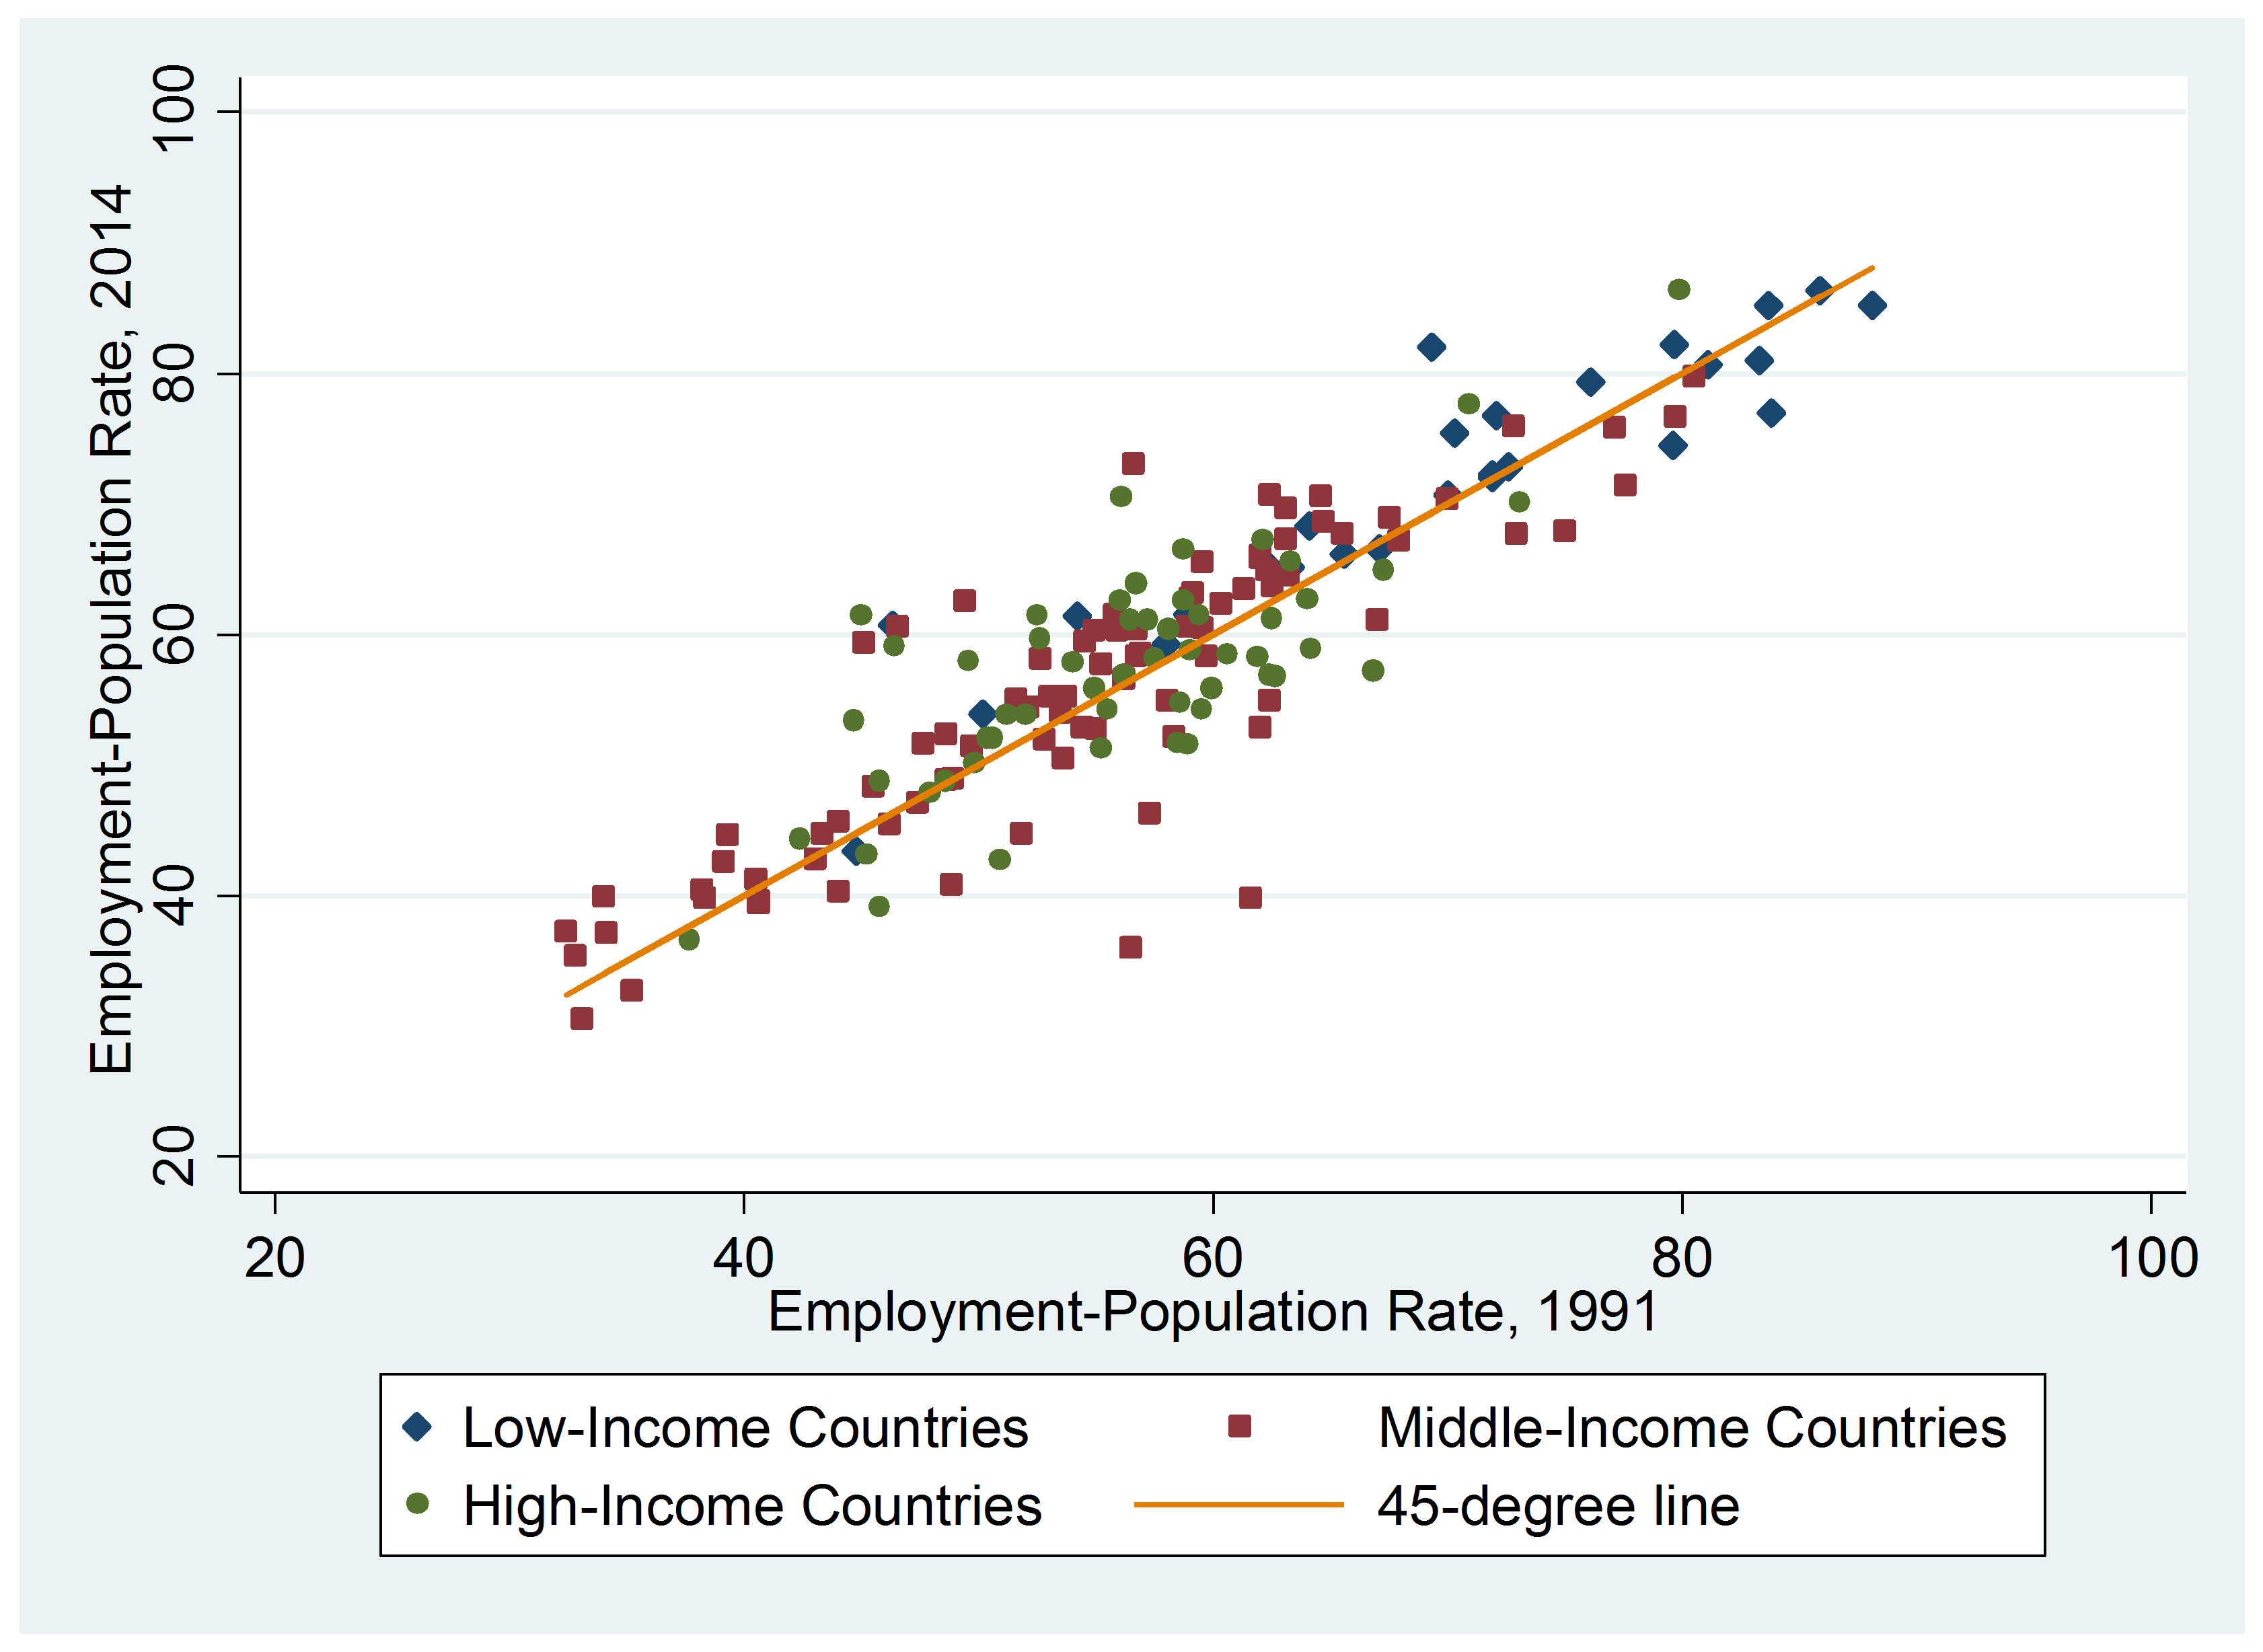
Figure 1: Employment-Population Rates in 2014 and 1991
But what about the quality of jobs on offer? One way to consider this is to look at the occupational structure of employment. Table 1 presents estimates of the decadal changes in the shares of employment in 1-digit occupations, for the world as a whole and low-, middle- and high-income countries.
Table 1:
Estimated Decadal Changes in Employment Shares of Major Occupation Groups, 1998-2014
| ISCO Major Groups | All Countries | Low-Income Countries | Middle-Income Countries | High-Income Countries | |
| 1 | Managers | 0.3 | -1.9 | 0.1 | 0.5 |
| 2 | Professionals | 2.6 | -0.1 | 3.2 | 2.1 |
| 3 | Technicians and Associate Professionals | 1.2 | 5.3 | -2.0 | 2.1 |
| 4 | Clerical Support Workers | -1.3 | -8.7 | 0.5 | -1.8 |
| 5 | Services and Sales Workers | 1.9 | 6.7 | 4.1 | 1.3 |
| 6 | Skilled Agricultural, Forestry
and Fishery Workers |
-0.6 | -0.6 | -1.7 | -0.2 |
| 7 | Craft and Related Trades Workers | -3.3 | -5.5 | -3.7 | -3.2 |
| 8 | Plant and Machine Operators and Assemblers | -0.8 | -2.1 | 0.0 | -1.0 |
| 9 | Elementary Occupations | 0.1 | 7.0 | -0.4 | 0.2 |
Notes: these are estimated changes in percentage points over a decade from an unbalanced panel for 1998-2014 in which the weights designed to add to total employment in the world and correct for the probability of data on the occupational structure of employment being observed.
For the world as a whole one can see the decline in the employment shares of clerical workers and skilled workers in agriculture and manufacturing. But professionals, associate professionals and service/sales workers have seen rising shares. These trends are not exactly the same in countries at different levels of development but all have a fall in craft workers, most have a fall in clerical workers, and a rise in service/sales workers[1]. There is some element of polarization here but the overall trend seems to be towards better jobs.
But statistics on the stable fraction of people in work and the types of work that they do may not do justice to a growing sense of insecurity in work felt by many workers. The changes produced by new technology and globalization have consequences for individuals. However, statistics on labour turnover rates do not always support the perception of growing instability e.g. Davis, Faberman and Haltiwanger (2012) document a downward drift over time in labour turnover in the US.
But progress is not just measured in employment rates- incomes are also important. New technology and globalization may have large effects on the distribution of output. There are a number of aspects to these concerns.
First, there are concerns that new technology and globalization primarily benefit the owners of capital relative to labour – that machines are increasingly competitive with labour, and that globalization is more to the advantage of footloose capital and increased financialisation than to labour which remains less mobile. Some studies argue for a fall in labour’s share in income in most countries at all stages of development (Karabarbounis and Neiman, 2014). Others argue that the impact is much less dramatic once one takes one includes things like health insurance costs and pension contributions in total labour costs (Pessoa and van Reenen, 2013).
And then there is the distribution of income among workers. There are many aspects of this – the evolution of wage inequality within countries both at the bottom and the top of the wage distribution, and the evolution of between-country inequality. The overall consensus (Bourguignon, 2015, Milanovic, 2016) is that the recent period has seen has been associated with rising inequality within many countries, with especially large gains for the top 1% (Piketty, 2014). But at the same time there may have been the largest fall in inequality between countries since the Industrial Revolution so that the impact of new technology and globalization cannot be accurately summarized by simple statements like ‘rising (or falling) inequality’. Milanovic (2016) estimates how people at different points in the world income distribution have fared over the period 1988-2008, reproduced in Figure 2. He finds gains a 65% increase in real incomes for the top 1% but – perhaps surprisingly – those at the world median have done better[2]. This is primarily the result of rapid real income growth in China and other large developing countries. In contrast the groups that have fared worst are those at the 80th percentile of the world income distribution, a position that corresponds to the average citizen in the richest countries. Many of the richest countries have experienced stagnation or even falls in real living standards for the average worker (McKinsey, 2016, estimate that 65-70% of households in advanced economies have had flat or faling incomes in the period 2005-2014, compared to only 2% in 1993-2005. Whether this is the result of globalization, new technology, institutions or the financial crisis remains subject to debate but these trends are posing serious challenges for countries that have been the richest and most stable politically.
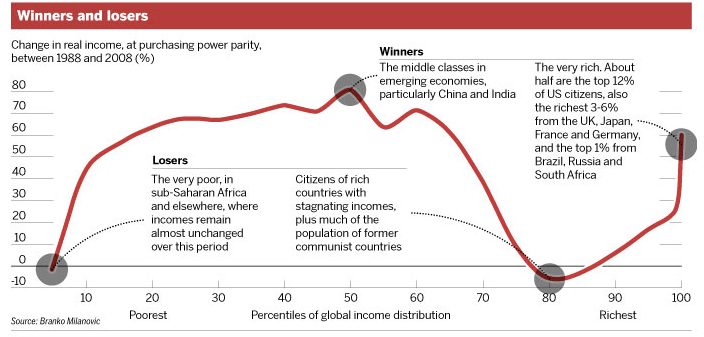
Figure 2: Winners and Losers Globally, 1988-2008 (Milanovic, 2016)
[1] One should interpret these results with a degree of caution as ILO (2015a) reports results of a similar exercize that are not exactly the same and the data availability and comparability are not as good as one would like.
[2] This is consistent with a high share of total income gains in the world going to the top 1% as their incomes are so much larger than median incomes.